Cyclic adenosine monophosphate (cAMP) acts as a ubiquitous secondary messenger in several receptor signaling pathways. Its intracellular fluctuations are often used as a quantifiable index of receptor signaling, in functional in vitro assays but this generally implies lysing cells. Since FRET-based cAMP sensing offers the distinct advantage of enabling cell signalling time-course experiments, using living cells, the aim of this study was to correlate the FRET readout with the intracellular cAMP concentration and produce a mathematical relationship which could be used for quantitatively monitoring changes in cAMP concentrations in living cells. Identical parallel experiments were carried out for real-time FRET-based sensing on living cells and standard ELISA-based cAMP quantification on cell lysates stimulated with varying concentrations (0-30µM) of the adenylate cyclase activator forskolin. Non-linear regression analysis found the ELISA and FRET data to be related in a sigmoidal log-transformed 4-parameter logistic function (r2=0.9744) within the range of 0.5µM to 30µM forskolin. The protocol designed is shown to enable the correlation of FRET signals to intracellular cAMP concentration over the range of 0-200nM, making FRET-based real-time cAMP monitoring, not only a useful qualitative approach to monitor signaling events in living cells, but also enables the quantitative determination of the cAMP fluctuation in the relevant cellular system.
Cyclic AMP (cAMP) is a ubiquitous secondary messenger that regulates numerous cellular events and complex biological processes [1]. Cells produce cAMP from ATP by enzymes called adenylyl cyclases (ACs), localised at the plasma membrane [2], while phosphodiesterase (PDE) quickly breaks down cAMP by hydrolysis to AMP [3, 4].
Its function as a secondary messenger makes it a prime target for signalling analysis but so far it has been very difficult to quantify this molecule effectively in the lab. The current quantitative standard method is by Enzyme-linked immunosorbent assay (ELISA) but the cells being studied need to be lysed and this only provides a snapshot profile of signaling activity (i.e. secondary messenger status at the time of lysis), impeding the collection of real-time measurements in living cells. The non-destructive option is Forster Resonance Energy Transfer (FRET), which is a non-radioactive transfer of energy from an excited donor fluorophore to a suitable acceptor fluorophore in close proximity (<10nm) and in the correct orientation. Such an energy transfer results in donor-induced excitation of the acceptor fluorophore and subsequently fluorescence, which can be measured ratiometrically as a ratiometric time-lapse plot [5].
The real-time monitoring of cAMP changes in living cells has been made possible through the construction of Epac-based FRET sensors. Epac1 (Exchange protein directly activated by cAMP 1) is a guanine nucleotide exchange factor for the small GTPases Ras-related proteins RAP1A and RAP2A, which is activated by binding cAMP. It have been shown that cAMP acts by relieving the interaction between the regulatory and catalytic domains of Epac1 and is indispensable for the activation [6, 7]. To date, three types of Epac (Epac 1, Epac 2A and Epac 2B) are known, which are expressed in different parts in the body [8].
The Epac-fusion construct that has been chosen for this study is referred to as CFP-Epac(dDEP,CD)-VENUS. It consists of part of the cAMP-binding protein Epac1, which has had the membrane-targeting DEP-sequence removed (dDEP), thus making it catalytically dead (CD), fused with a donor Cyan Fluorescent Protein (CFP) at its N-terminus and an acceptor VENUS (a variant of Yellow Fluorescent Protein - YFP) at its C-terminus [9].
Under basal conditions, the two fluorophores are in close proximity to each other and upon radiation with the CFP-excitation wavelength, FRET occurs due to the donor (CFP) emmission wavelength exciting the acceptor (VENUS) and causing it to fluoresce and give a FRET signal. Upon binding of cAMP to the Epac domain in the fusion construct, the latter undergoes a pronounced conformational change, which moves the fluorophores apart, resulting in a robust decrease in FRET readout. This signal is converted into a donor emission to acceptor emission intensity ratio, which can then be used to determine the intracellular cAMP concentration [10, 11].
This FRET sensor is expressed in the cytoplasm and able to respond to changes in cAMP concentrations within the physiological range of around 0.1–100 µM, although the lower limit tends to be about 14µM [7, 9]. Moreover, the FRET signal can be decreases by stimulating cAMP-production using agonists such as forskolin (a direct activator of adenylyl cyclase), epinephrine, prostaglandin E1 or neurokinin A, and recovers upon treatment with antagonists such as α2-adrenoceptors, OPC-31260 and its synthetic analogue tolvaptan [7]. In cAMP-related FRET experiments it is also common to add 3-isobutyl-1-methylxanthine (IBMX) to inhibit PDE from hydrolysing cAMP, thus allowing the measurement of cAMP [7].
However, as things stand at present, the use of such FRET sensors is not yet quantitative. A standard calibration method needs to be developed in order to use this method quantitatively. It is of great relevance to determine a protocol that can be used to correlate the FRET readout with the intracellular cAMP concentration and produce a mathematical relationship which can be used for quantitatively monitoring changes in cAMP concentrations in living cells.
CHO-K1 cells were cultured in Dulbecco’s Modified Eagle’s Medium (DMEM, Sigma D5648) with 10% Foetal Bovine Serum (FBS, Sigma Life Science F7524) and 1% Penicillin/Streptomycin (PenStrep) solution (Gibco by Life Technologies, Catalogue Number - 15140) at 37°C, 5% CO2 and > 95% humidity.
CHO-K1 cells were cultured in a T-75 flask for 3 days (until >80% confluent) and transfected with the FRET cAMP sensor CFP-Epac(dDEP,CD)-VENUS, using FuGENE® HD as transfection reagent, and a DNA:FuGENE® HD ratio of 1:4, following the manufacturer’s protocol.
Transfected cells were treated with 500μM IBMX (from a 5mM IBMX stock solution - with 2.5% DMSO) to block PDE activity and incubated for 20 minutes prior to forskolin stimulation. The final in-well DMSO concentration of 0.25% was considered to be sufficiently low as not to interfere with cell viability.
Transfected cells were then stimulated with the adenylate cyclase activator forskolin, at varying concentrations of 0-30µM (using a 250μM aqueous forskolin stock solution) and incubated for 15 minutes prior to analysis of live cell cultures by FRET and cell lysates by a cAMP-specific ELISA.
Each FRET assay experiment was carried out in parallel with its respective ELISA assay, which was used in order to determine absolute cAMP concentrations in the cells. Experiments were carried out in 96 well plates using a CHO-K1 cell density of 5 x 10⁵ cells per well, suspended in a total well volume of 100µl PBS as previously reported [12]. PBS was used as a medium for FRET-signal reading due to the high background fluorescence of DMEM, even in the absence of phenol red. All FRET assays were carried out in black microtitre plates, in order to minimise optical internal reflection and cross-well signal interference. FRET signals were measured by exciting the sample at 450nm (CFP excitation) and reading emission intensities at 480nm (CFP emission) and 535nm (VENUS emission). The FRET ratio of CFP emission/VENUS emission was calculated, corrected for non-Epac-sensor background fluorescence (by subtracting the respective fluorescent values for identically treated untransfected cells).
Twenty-four hours post-transfection, the cells were trypsinised and washed two times with PBS for complete removal of medium. The cells were suspended in PBS, in a black 96 well plate at a density of 5x10⁵ cells/well (in 78µl). The components were added in the following sequence: cell suspension, PBS, IBMX followed by 30 minutes incubation, forskolin (0-30μM) followed by 15 minutes incubation. The FRET signal was read using the Mithras LB940. The following filters were used in the Mithras LB940 – CFP excitation 450nm, CFP emission 480nm and a VENUS emission of 535nm.
Epac-transfected CHO-K1 cells, suspended in PBS, were treated with IBMX and forskolin in sterile microcentrifuge tubes (rather than microplates, in order to facilitate subsequent cell pelleting, supernatant removal and lysis). All in-tube concentrations of IBMX and forskolin were identical to those used in the FRET procedures, and it was ensured that scale changes were carried out in such a way that they did not influence the final in-tube concentrations. Based on the ELISA manufacturer-recommended cell numbers required for analysis, the cells were diluted to 107 cells per ml and therefore 1.25 x 10⁶ cells (250μl) were used for each ELISA well. The cells were centrifuged, the supernatant was discarded and the pellets lysed.
ELISA was performed using a commercial cAMP ELISA assay (R&D systems, Catalogue No KGE002B), following the supplied manufacturer’s instructions. In short, 50μl of Primary Antibody Solution was added to all the wells except to two wells representing non-specific binding (NSB). The NSB wells were used to determine non-specific ELISA signals, and the absorbance values given by these wells, were later subtracted from the readings of the rest of the plate. The adhesive strip provided was used to cover the wells, and incubation was carried out for 1 hour at room temperature on a horizontal orbital microplate shaker (0.12” orbit) set at 500 rpm. Following incubation each well was aspirated and washed 4 times with washing buffer. To all wells, 50μl of cAMP conjugate was added, followed by 100μl of standard, control, or sample in the appropriate wells. One hundred microliters of 1X Cell Lysis Buffer was added to the non-specific binding (NSB) and zero standard wells. The wells were covered with a new adhesive strip, and incubated for 2 hours at room temperature on the shaker. The aspiration/wash procedure detailed previously was repeated. Following this 200μl of substrate solution was added to each well. The plate was incubated for 30 minutes at room temperature. Then, 100μl of stop solution were added to each well and a colour change from blue to yellow was observed. The optical density of each well was determined within 30 minutes, using a microplate reader (Mithras LB940) set to 450 nm. In such an ELISA, the colour intensity is inversely proportional to the concentration of cAMP in the sample.
A Berthold Mithras LB940 multimode reader, operating under Berthold-supplied Mikrowin 2000 software for Windows, was used to gather both the absorbance and fluorescence data. The data-analysis component of the same software was used for data analysis.
The mean CFP emission fluorescence obtained from untransfected, untreated cells was subtracted from the CFP emission fluorescence obtained from transfected, forskolin-treated cells. The VENUS emission fluorescence obtained by untransfected, untreated cells was subtracted from the VENUS emission fluorescence obtained from transfected, forskolin-treated cells (to eliminated the contribution background fluorescence which was not due to the presence of the FRET sensor. e.g. cellular auto-fluorescence). The corrected values for CFP and VENUS fluorescence were then divided by each other in order to obtain a CFP/VENUS ratio for each microwell. The ratios from triplicate repeat wells were averaged in order to obtain a mean ratio and standard error of the mean. In line with approaches commonly used in fluorescence-based and luminescence-based cell assays, the forskolin-induced FRET signal was expressed as a fold change over the baseline FRET. Thus, the corrected CFP/VENUS ratio of each forskolin-treated transfected sample was divided by the mean corrected CFP/VENUS ratio of the zero-forskolin-treated transfected samples, in order to obtain a fold change in FRET signal of forskolin-treated over forskolin-untreated cells. Effectively, this provided a FRET-based fold change measurement of forskolin-induced cAMP over baseline cAMP.
The absorbance values of the NSB wells were averaged and subtracted from all other well absorbances. The corrected absorbance values for the set of cAMP standards were used to generate a calibration curve. Backfitted cAMP values were computed by Mikrowin 2000 for Windows, by applying a 4-parameter logistic curve fit model, on a logarithmic x-axis. This curve was used to back-fit the absorbance values of all assay samples, in order to determine the cAMP concentration of the respective lysates.
The absolute cAMP concentrations from the ELISA assay were correlated to the FRET-readouts following normalisation in order to establish a relationship so that cAMP levels could effectively be monitored in real-time using the Epac FRET sensor. A plot for the ELISA-determined CHO-K1 lysate cAMP concentrations against the FRET fold ratio, for every concentration of forskolin used was generated and attempts were made to fit the data to various mathematical expressions, using Graphpad Prism version 6 graphing and analysis software for Windows.
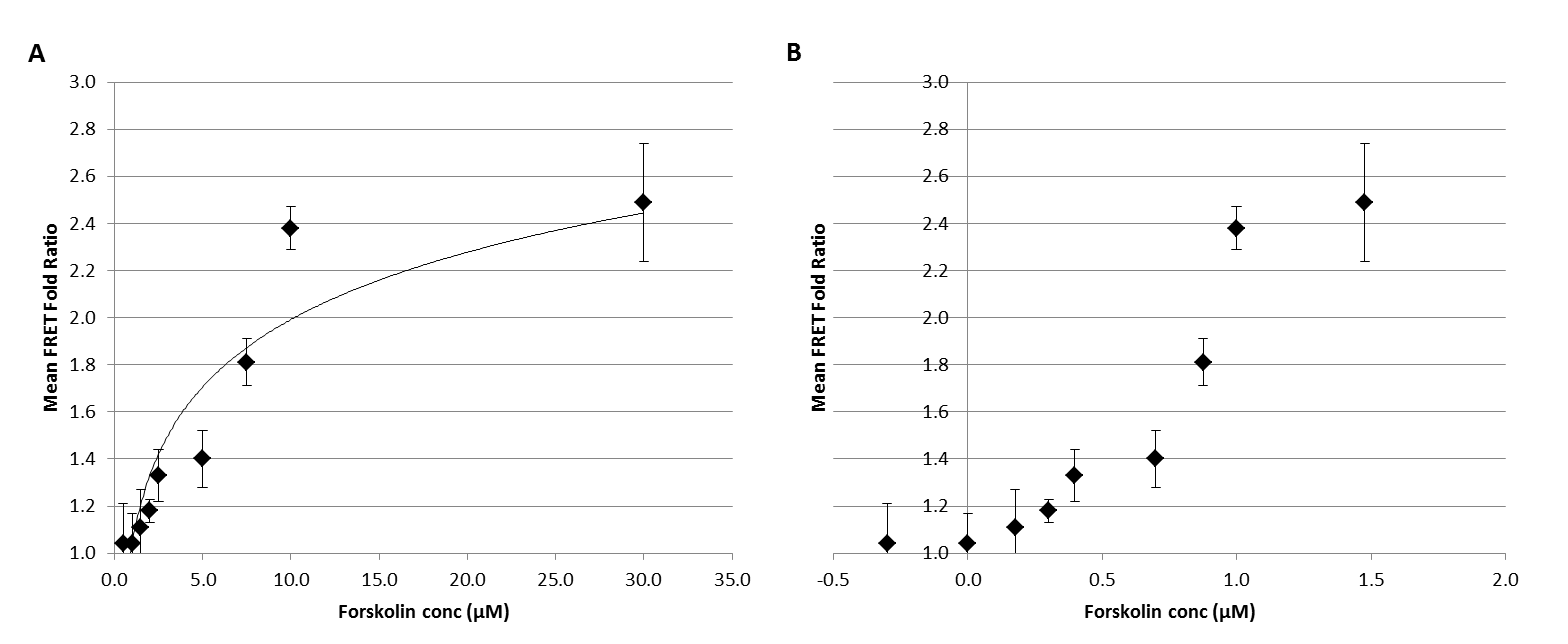
The fluorescence at CFP and VENUS emission wavelengths, excited with the CFP excitation wavelength of 450nm were collected for cell suspentions in PBS. PBS was selected as the reagent of choice, due to its low background and its known ability to maintain short-term cell viability. The mean fold ratios calculated varied from 1.0 to 2.5 over the forskolin concentration of 0 to 30µM. These values had a corresponding SEM varying between 0.05-0.25. Based on this data two graphical reprsentations have been prepared (Fig 1) representing the forskolin concentrations in both linear (Fig 1A) and logarithmic (Fig 1B) scale.
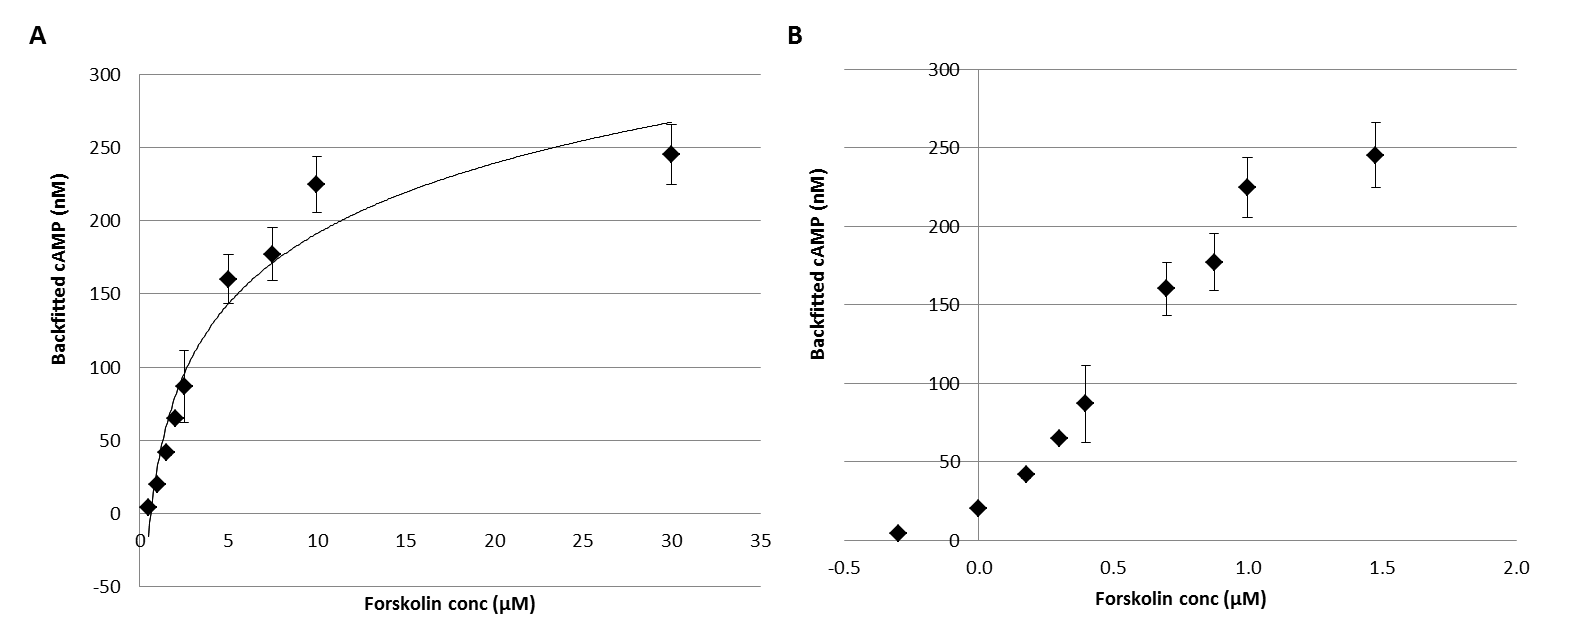
The ELISAs for each cAMP induction experiment were performed following the determination of calibration curves for standard concentrations of cAMP (0-240 nM). Raw absorbance data for the colorimetric competition assay was collected and subracted from the total to obtain the absorbance value for the forskolin induction. The corresponding cAMP concentrations in the cell lysates, were bacfitted based on the experimental values for absorbance from each ELISA standard curve. The backfitted cAMP calculated varied from 0 to 250nM over the forskolin concentration of 0 to 30µM. These values had a corresponding SEM varying between 0.0-24.29. Based on this data two graphical reprsentations have been prepared (Fig 2) representing the forskolin concentrations in both linear (Fig 1A) and logarithmic (Fig 1B) scale.
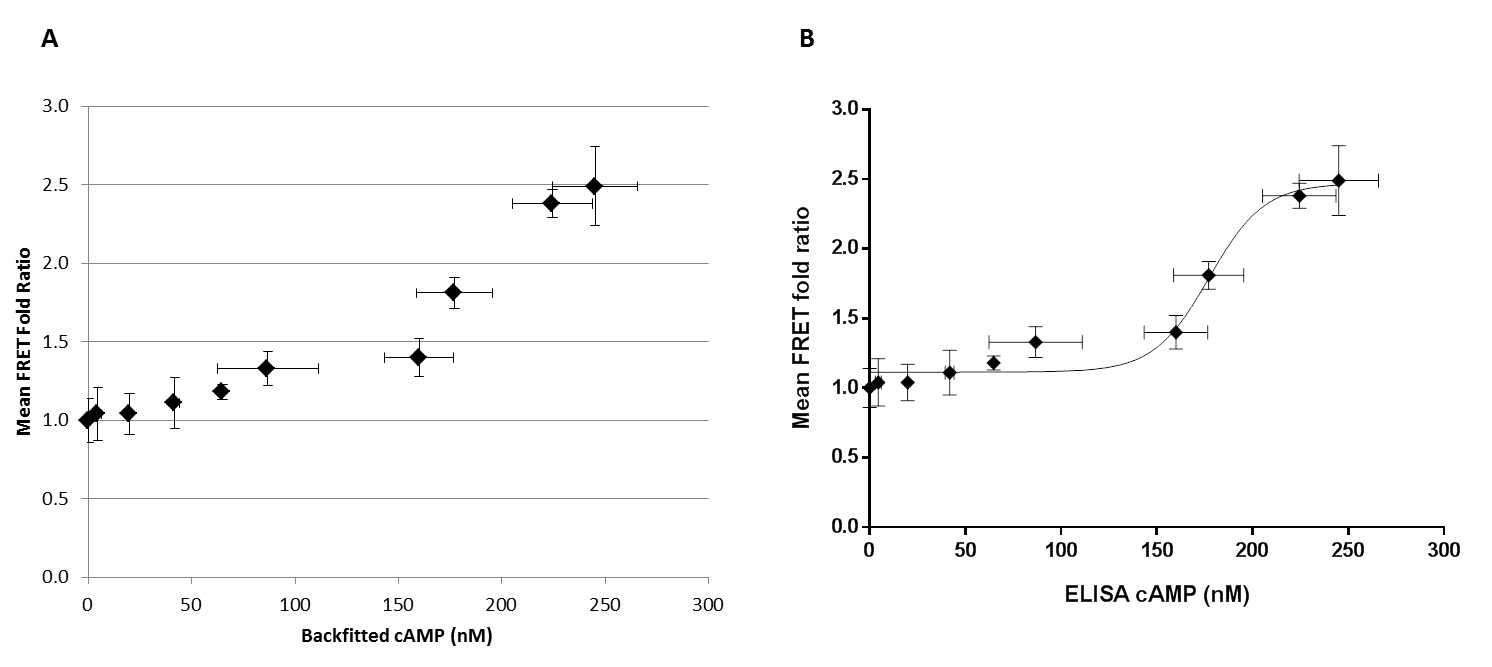
The FRET-assay based fold signals, for the forskolin concentrations 0.5μM to 30.0μM were plotted against the ELISA-quantified lysate cAMP concentrations in linear scale(Fig 3A). Non-linear regression was performed on the FRET-assay fold signals, covering the same forskolin range (0.5μM to 30.0μM), with log10-transformed ELISA-quantified lysate cAMP concentrations (Fig 3B). This identified a sigmoidal 4-parameter logistic relationship between the two data sets. This regression had an R2 value of 0.9744, as computed by Graphpad Prism version 6 for Windows. The model for a 4-parameter logistic fit is the following, where the relationship between X and Y is defined by 4-parameters, for which optimum values must be determined for the best fit. Y=B + [(T-B)/(1+10^((Log10EC50-X)*HillSlope))] Where, B = Y-value at the bottom plateau; T =Y-value at the top plateau; EC50 = X value at Y=50% of the maximum; HillSlope = a value that describes the steepness of the curve. The optimum values for the 4-parameter fit, as computed by Prism 6, are as follows: T = 1.406; B = 0.8233; HillSlope = 17.06; EC50 = 466.6 (Log10EC50 = 2.669). The graphical representation describes a correlation of FRET signals to intracellular cAMP concentration which is best suited for a range of 0-200nM cAMP.
The advantage of maintaining cell viability, gives FRET-based sensor analysis a prominent place within the repertoire of methods to follow biological signaling pathways. Such a system has been previously used only for qualitative confocal imaging purposes, as a real-time response system to observe cellular cAMP generation [10] but never considered critically for quantitative or semi-quantitative purposes. This study was thus undertaken to investigate the mathematical relationship between the FRET readouts of an Epac-based FRET sensor and ELISA-based cAMP measurements, as a tool to quantitatively monitor fluctuations of cellular cAMP concentration in live cells.
As cAMP is ubiquitously found in cells, and is a biological responder of several pathways, having a system which can monitor in real-time, the levels of this signalling molecule, lends itself to use in a wide range of research applications. This approach has the clear advantage of providing a means of monitoring biologically-induced cellular cAMP generation, within a real-time framework, and without killing the cells under investigation, such that cells are thus still amenable to further testing.
This study tested up to a maximum forskolin concentration of 30µM, which could be amenable to FRET or ELISA-based monitoring. This corresponded to a lysate cAMP concentration of 245.09nM. At the highest forskolin concentration used (30µM), the ELISA assay over ranged, while no additional FRET signal was evident. The plot of FRET signal against ELISA-determined cAMP, fits a 4-parameter logistic equation. Within the Hill-slope region (the slope flanked by both plateaus of the sigmoidal curve, ranging from 2.75µM to 9.5µM forskolin) a linear relationship was identified (r2=0.8085, p=0.026). This corresponds to a lysate cAMP concentration range of around 125nM to 225nM. The Hill-slope region is the region which is most sensitive in terms of FRET signal variation with change in cAMP concentration. Therefore, this FRET-based system provides an effective real-time end-point monitoring system, for a range of cAMP concentrations which is however narrower than what can be conventionally measured using ELISA-based lysate analysis. This observation arises from the fact that ELISA retains sensitivity to cAMP concentrations well-beyond the range of FRET. For the ELISA kit used the range of detection is up to 240µM, with higher cAMP concentrations easily measured by sample pre-dilution and dilution factor calculation. This is not possible with a FRET sensor system.
As with all cell-based methodologies, this too includes a number of inherent assumptions which must be taken into consideration during data analysis and interpretation of the relationship between FRET signals and absolute cAMP concentrations in cells. This is because the actual FRET signals are influenced not only by the actual cAMP generated, but also by several other variables, including cell type used, transfection efficiency (primary cells are invariably more resistant to transfection than transformed cell lines), and inter-day variability (cell passage numbers, reagent and growth media batches, variations in instrument sensitivity and lamp energy) among others. Moreover, variation in CFP signal in different transfected cells could depend on endogenous factors reducing forskolin availability, cellular pH could affect protein folding or cell-specific enzymes could add unwanted post-translational modifications or alter some of the CFP protein.
In order to reduce such variability especially for long running receptor expression and signaling studies, it is more feasible to develop a cell line which is stably transfected with the Epac FRET sensor since this would maintain constant expression levels. To increase the degree of precision it is best to increase the number of repeats as much as possible, generating lower SEM values, easily identifying and eliminating outliers and overall increasing the statistical power to identify correlations. A further improvement, if the hardware permits, is the use of well scanning mode rather than standard well reading. Well scanning mode is a feature of some multimode plate readers that allows scanning each well at a resolution of about 100 pixels per well, and generating a FRET data point for every pixel scanned. This allows the collection of data only in well regions which actually contain fluorescence, thus eliminating regions of untransfected cells or cell-free regions due to non-uniform cell distribution.
The application envisioned for such a FRET-based quantitative real-time determination of cAMP concentrations in molecular biology and pharmacology covers a wide spectrum of experiments e.g. functional receptor activity such as GPCR-signaling through a cAMP-dependent mechanisms. The FRET sensor system can be modified to a Time-resolved FRET (TR-FRET) system, which involves using time-resolved fluorophores instead of CFP and VENUS. This allows cell media rather than PBS to be used while minimising background non-substrate induced fluorescence. This principle can also be applied to generate other FRET sensors for the monitoring of non-cAMP molecules.
At present our lab is investigating the outcome using different cell lines as well as the time point for maximum FRET sensitivity (post-forskolin incubation), since long post-forskolin incubations result in readouts of the accumulated cAMP, rather than that which is released as an immediate response to actual concentration used for stimulation. At a later stage we plan to test the system in a real application environment, by co-transfecting the Epac-fusion construct with an appropriate Gs-coupled GPCR cDNA expression vector (e.g. HTR4, OPRM1, ADRB2) and activating the expressed GPCR with a specific agonist ligand.
In conclusion, the data obtained from this study provides evidence that a live cell cAMP FRET sensing approach is very amenable to real-time monitoring of cAMP-dependent cell biology, and correlates, with appropriate mathematical data transformation, to absolute cAMP measurements. Such an approach has several applications in molecular biology, and is a valid method which can be used as part of the toolset to monitor cAMP fluctuations in various biological processes including receptor signaling, within living cells.
Special thanks to Dr Charlotte Billington from the University of Nottingham, UK for providing the cAMP FRET-sensor plasmid.
- Beavo J, Brunton L. Cyclic nucleotide research -- still expanding after half a century. Nat Rev Mol Cell Biol. 2002;3:710-8 pubmed
- Cooper D. Regulation and organization of adenylyl cyclases and cAMP. Biochem J. 2003;375:517-29 pubmed
- Houslay M, Adams D. PDE4 cAMP phosphodiesterases: modular enzymes that orchestrate signalling cross-talk, desensitization and compartmentalization. Biochem J. 2003;370:1-18 pubmed
- Soderling S, Beavo J. Regulation of cAMP and cGMP signaling: new phosphodiesterases and new functions. Curr Opin Cell Biol. 2000;12:174-9 pubmed
- Förster T. Intermolecular energy migration and fluorescence. Ann Physiol. 1948; 23: 55-75.
- de Rooij J, Zwartkruis F, Verheijen M, Cool R, Nijman S, Wittinghofer A, et al. Epac is a Rap1 guanine-nucleotide-exchange factor directly activated by cyclic AMP. Nature. 1998;396:474-7 pubmed
- Ponsioen B, Zhao J, Riedl J, Zwartkruis F, van der Krogt G, Zaccolo M, et al. Detecting cAMP-induced Epac activation by fluorescence resonance energy transfer: Epac as a novel cAMP indicator. EMBO Rep. 2004;5:1176-80 pubmed
- Billington C, Le Jeune I, Young K, Hall I. A major functional role for phosphodiesterase 4D5 in human airway smooth muscle cells. Am J Respir Cell Mol Biol. 2008;38:1-7 pubmed
- Haase T, Kamann S, Brux A. FRET as a Tool to Study G-protein Coupled Receptor Oligomerisation in HEK Cells. Berthold Technologies. 2011.